February 2014 Home Sales Stats – Armour Hills, Brookside

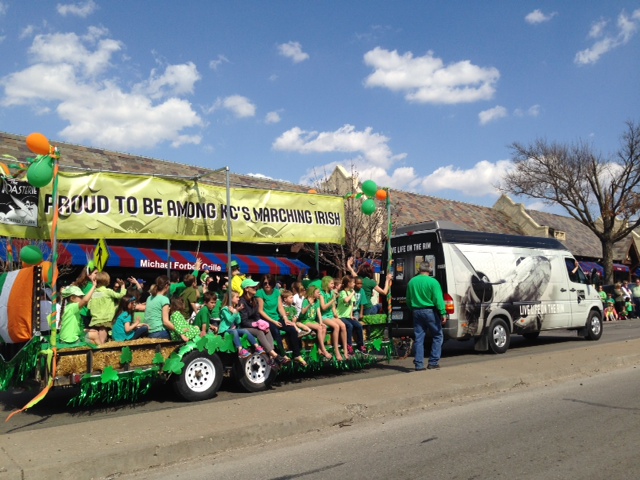
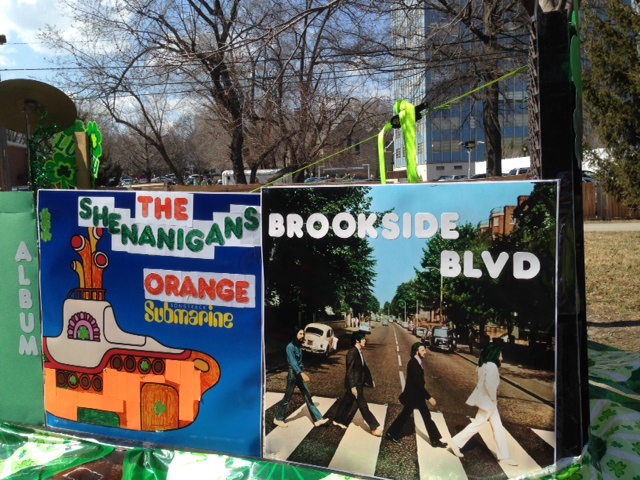
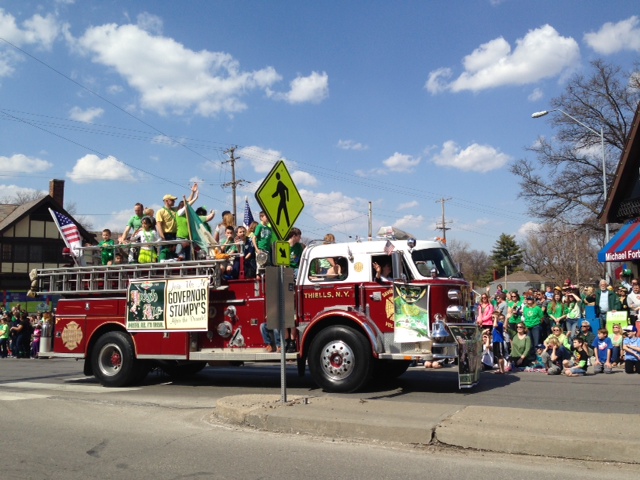
How many people showed up for the Brookside St Patrick’s Day Warm Up Parade on Saturday?  Hard to tell…thousands for sure, as it was a beautiful day!  I saw so many neighbors and friends while walking around, watching kids pick up tossed candy and older adults comfortably seated on the sidelines to watch the festivities. This event shows off the diversity of Brookside residents and how we all come together for a good time in support of our neighborhood.  Special thanks to Marti Lee and her team at Southtown Council for their hard work in pulling this event together every year, whatever the weather.

It’s that time of the month where I check monthly home sales stats for the Brookside area.  This blog will focus on my neighborhood of Armour Hills–below see a summary of February 2014 sales with a comparison to February 2013:

Three  homes sold in February 2014, with an average list price of $226,450 and an average sales price of $223,800.  Average days on market:  32.

Four homes sold in February  2013, with an average list price of $261,238 and an average sales price of $257,375.  Average days on market:  79.

Although we had one less sale last month than a year ago–look at the days on market.  Less than half compared to  Feb 2013.  The average sales price was significanltly higher in 2013 because one home sold for $390K–an unusually high price for AH which skewed the numbers up.

Looking at year to date figures:

For the first two months of 2014, seven homes have sold at an average price of $239,333 and 22 days on the market.  For the first two months of 2013, six homes sold at an average price of $245,250 and 62 days on market.  Again, the $390K sale upped the 2013 average price, with days on market much shorter this year.

Currently there are 13 homes for sale in Armour Hills, with a median average list price of $244,000 and 98 days on market. I am using the median price as the house at 6625 Brookside Road is priced at $450,000–on the high end for our area.

Below I posted a few pictures from the parade on Saturday.  Be safe today as you celebrate St Patrick’s Day! Watch for wobbly pedestrians.  I’ve decided on a U2 music marathon today as I work at my desk.  Turn it up!

(All stats taken from Heartland MLS; deemed reliable but not guaranteed)

Mark house 2014

Roasterie 2014

album cover 2014

Stuff 2014

Stumpy 2014

Armour Hills Home Sales Market Report – October 2013

It’s just amazing how much home prices have jumped in Armour Hills this year!  Buyers are snapping up the updated, well maintained and show – ready homes within a few days of hitting the market!  Here are the details for last month:

In October  2013, 9  homes sold.  The average list price was $256,078 and the average sales price was $256,211.  Average days on market: 24. (note the average sales price here is higher than the list price!)

In October  2012, 5  homes sold.  The average list price was $211,780 and the average sales price was $201,720.  Average days on market: 61.

Average home prices for October of this year are up 27% over last October, and almost twice the numbers of homes sold, with days on market less than half of the previous year.

Let’s compare year-to-date figures:Print

In the first ten months of 2013, 70  homes sold with an average sales price of $260,792 and 62 days on market.

In the first ten  months of 2012, 68 homes sold with an average sales price of $217,919 and 82 days on market.

Home prices are up over 19% over last year..wow!

As of this writing, there are 15 homes for sale in Armour Hills, with an average list price of $271,142 and 77 days on market.

If you would like specific sales figures from your neighborhood, contact me.

(All figures taken from Heartland MLS and deemed reliable but not guaranteed.)

Armour Hills Home Sales Stats January 2013

Armour Hills, a Brookside area subdivsion

Armour Hills, a Brookside area subdivsion

You’ve heard it in the media…now read about it in your own neighborhood. Home prices are up! Let’s check the January home sales stats for Armour Hills:

In January 2013, two homes sold. Average list price was $235,000 and average sales price was $221,000. Average days on market…just 26 days!

Now let’s compare to Jan 2012 and Jan 2011:

In January 2012, two homes sold. Average list price was $224,500 and average sales price was $215,000. Average days on market…43 days.

In January 2011, one home sold. The list price was $145,000 and the sales price was $146,777. Average days on market for the one sale was 158 days.

There is no doubt that home prices are on the rise in Armour Hills. I track the sales every month, and 2012 finished with more homes sold than 2011, a higher average sales price and less time on the market. I expect this trend to continue in 2013.

Currently there are nine homes for sale in Armour Hills, with an average price of $235,089, Overall, there is a lack of good inventory in the Brookside area. If you’ve been waiting for the market to change in the seller’s favor…now is the time to list your home! If it’s been well maintained, priced correctly and updated, you may have competing offers.

Contact me if you would like more details on the current state of the home sales market in Brookside.

(All stats taken from Heartland MLS; deemed reliable but not guaranteed.)

Armour Hills 2012 Home Sales Market Report

Now that we are a few weeks into the new year, it’s time to look back at 2012 home sales statistics for Armour Hills. When I checked the stats each month last year, the trend was more homes sold and at a higher average price than 2011. I think the worst of the housing crisis is over for our Brookside neighborhood!

Armour Hills Homes in Brookside

Armour Hills Homes in Brookside

Here are the figures for 2012 single family home sales in Armour Hills:

In 2012, 78 homes sold. The average list price was $225,465 and the average sales price was $219,338. Average days on market: 83.

In 2011, 59 homes sold. The average list price was $220,551 and the average sales price was $212,088. Average days on market: 119.

In summary, 25% more Armour Hills homes sold in 2012 than 2011, and with a higher average sales price of almost 5%–very healthy numbers!

Something else I want to point out: the lowest sold price in 2012 was an $80,000 short sale. However, we had two homes sell over $400K–one at $485,000 and another at $417K. The highest sales price in 2011 was $350K. Both of these higher priced homes were total rehabs. This shows our neighborhood is desirable for more affluent buyers and we have a good area for rehabber /homeowner improvement investing.  Finally, with the average home price in the $220s, Armour Hills is still very affordable for most first time buyers, despite the two over $400K sales.

I’ll continue to track monthly sales for 2013 in this blog. The upward trend in number of homes sold and increasing average sales prices should continue this year.

Interested in home prices and sales trends in your area? Email me and I’ll provide the information. In a few days I will post home sales stats for the Brookside zip code of 64113–also showing better sales activity than last year.

(All statistics taken from Heartland MLS; deemed reliable but not guaranteed)

Armour Hills Home Sales Stats November 2012

I’m enjoying looking out the window, appreciating the beauty of this first snowfall of the season!  So nice to work from home and not have to drive to the office.  Just checked the November home sales for Armour Hills..let’s take a look at the numbers:

Armour Hills Homes Association, Brookside

Armour Hills Homes Association, Brookside

In  November  2012, 4 homes sold.  The average list price was $234,988 and the average sales price was $225,613. Average days on market:  138.

In November  2011, 6  homes sold.  The average list price was $258,900 and the average sales price was $247,625.  Average days on market:  140.

Although the average list price was lower compared to one year ago, keep in mind that just four homes sold in November.  It’s not unusual for sales to dip towards the end of the year.  When a few more expensive homes sell, that pushes up the average price.  Days on market are consistent. 

Year to date, 71 homes have sold in Armour Hills, at an average sales price of $218,619 and  80  days on market.  From January–November  2011, 54 homes sold at an average price of $216,708 and 122 days on market.  Overall, we in Armour Hills are experiencing lower days on market and an average sales price that’s higher than last year.  This trend has been consistent since January. I’m looking forward to comparing final 2012  figures in January 2013.  Prices are trending up–good news for buyers and sellers; our neighborhood is gaining in value.

Interested in home prices and sales trends in your area?  Email me and I’ll provide  the information.  In a few days I will post home sales stats for the Brookside zip code of 64113–also showing better sales activity than last year.

Armour Hills Home Sales Stats October 2012

Finishing up the tenth month of the year…home sales in Armour Hills continue to outperform 2011, however in October there was a lower average sales price.  Let’s check the stats:

In  October  2012, 5 homes sold.  The average list price was $211,780 and the average sales price was $201,720. Average days on market:  61.

In October 2011, 4  homes sold.  The average list price was $233,175and the average sales price was $223,525.  Average days on market:  93.

The average sales price for October 2012 is lower than what’s been trending this year, but last month  there was one sale at $80,000, which is unusually low for our area.  This  sale  brought the average price down.  Still, comparing to 2011, one more home sold  and days on market are down by 30 days over last year!

Year to date, 67 homes have sold in Armour Hills, at an average sales price of $218,202 and  76  days on market.  From January–October 2011, 48 homes sold at an average price of $212,643 and 119 days on market.  We are experiencing lower days on market and an average sales price that’s higher than last year.  This trend has been consistent since January.

I think we are past the bottom of the housing market in Armour Hills, and on an upward trend that should continue…if interest rates stay low and the economy stays on the  recovery track.

Interested in home prices and sales trends in your area?  Email me and I’ll provide  the information.  In a few days I will post home sales stats for the Brookside zip code of 64113–also showing better sales activity than last year.

(All statistics taken from Heartland MLS; deemed reliable but not guaranteed)

Armour Home Sales Up Again in September

Hello neighbors!  Good news to report about Armour Hills homes sales again. Prices and number of units sold continue to increase.  Read the details below for Armour Hills home sales, September 2012:

In  September 2012, 10 homes sold.  The average list price was $209,365 and the average sales price was $203,460. Average days on market:  48.

In September 2011, 4  homes sold.  The average list price was $226,600 and the average sales price was $217,375.  Average days on market:  89.

The average sales price for September 2012 is lower than what’s been trending this year, but last month  there were two sales below $100K, which is very low for our area.  These sales brought the average price down.  Still, comparing to 2011, more homes sold and less time on market!

Year to date, 62 homes have sold in Armour Hills, at an average sales price of $219,531 and  77  days on market.  From January-August  2011, 44 homes sold at an average price of $211,872 and 125 days on market.  We are experiencing lower days on market and an average price over $7000 higher than last year!

Interested in home prices and sales trends in your area?  Email me and I’ll provide  the information.  In a few days I will post home sales stats for the Brookside zip code of 64113–also showing higher sales prices.

(All statistics taken from Heartland MLS; deemed reliable but not guaranteed)

Armour Hills Home Sales Stats Aug 2012

Hello neighbors!  Didn’t it feel good to pull out a sweater or jacket this morning on the way out the door?  You can smell Fall blowing into Brookside!  And we are going into one of the prettiest time of years to walk our neighborhood.  The drought may negatively affect autumn tree colors this year..we will see soon.  Now, let’s check home sales statistics for last month:

In  August  2012, 8 homes sold.  The average list price was $245,925 and the average sales price was $234,809. Average days on market:  48.

In August  2011, 10  homes sold.  The average list price was $223,425 and the average sales price was $214,835.  Average days on market:  91.

WOW!  Average days on market was almost half of the 2011 figure, and average price was up almost 9%!

Year to date, 52 homes have sold in Armour Hills, at an average sales price of $222,622 and  83 average days on market.  From January-August  2011, 40 homes sold at an average price of $211,322 and 125 days on market.

HIgher prices and less days on market is good news for sellers–and for buyers.  Why?  Sellers are starting to recoup some of the equity lost during the housing crash and homes aren’t sitting on the market as long. Buyers can feel confident they are buying in a desirable neighborhood with rising home values.

Interested in home prices and sales trends in your Brookside area?  Email me and I’ll provide  the information!
(All statistics taken from Heartland MLS; deemed reliable but not guaranteed)

Armour Hills Home Sales Statistics- July 2012

Time for our monthly review of home sales in Armour Hills! Homes are selling quickly in our neighborhood. Let’s review the stats:

 
In July 2012, 9 single family homes sold.  The average list price was $225,422 and the average sales price was $224,111.  Average days on market:  53.

In July 2011, 5 single family homes sold.  The average list price was $226,460
and the average sales price was $224,470. Average days on market:  80.

Almost twice as many homes sold this year, although the average sales price is virtually unchanged. Days on market is shorter, which is good news for sellers. Also, notice how the average sales price is just about $1000 less than the list price.

Now let’s look at year-to-date figures:

From January-July 2012, 44 single family homes sold.  Average sales price was $220,406.  Average days on market: 89.

From January-July 2011, 30 single family homes sold. Average sales price was $210,151.  Average days on market: 137.

Year-to-date, average sales price has jumped up $10,000 from last year, more homes have sold and days on market has shortened by almost seven weeks! In addition, we had a home sell last month for $382,500–a very robust sales price for Armour Hills.

It will be interesting to see if these trends continue in the Fall, a  traditionally slower time for sales. Currently there are 18 homes for sale in Armour Hills, with an average list price of $245,975 and 126 days on market. If you would like moer specific information on home sales in the Brookside area, contact me!

(All figures taken from Heartland MLS; deemed reliable but not guaranteed.)

Armour Hills and Brookside Home Sales Statistics April 2012

I have not been blogging for several weeks…too busy with work, two graduations, and a great family vacation to New York City!  Back in the saddle today, and want to post home sales stats for April for the Brookside area…there is good news!!

Armour Hills subdivision

In April 2012, six homes were sold.  The average list price was $231,125 and the average sales price was $227,275.  Average days on  market:  42.

In April 2011, three homes sold.  The average list price was $224,450 and the average sales price was $209,333.  Average days on  market:  84.

Currently there are 23 homes for sale in Armour Hills, with an average list price of $241,791.

Average sales prices are up, and days on market are down!  Now let’s look at the main Brookside zip code of 64113:

64113 Zip Code

In April 2012, fifteen homes sold.  The average list price was $302,167, and the average sales price was $295,377,  Average days on market:  53.

In April 2011, nineteen homes sold.  Average list price was $248,160 and average sales price was $239,931.  Average days on market:  98.

Again, average sales prices are up, days on market are down.  Less units sold, but the higher sales prices and lower days on market shows buyers are committing to purchases. 

Currently, there are 115 homes for sale in zip 64113 with an average list price of $566,033.  The upper end homes are not selling as quickly as those priced under $350K, thus the higher average list price.

Would you like information on home sales in your area?  Email me! 

(All information based on single family home sales.  Stats taken from Heartland MLS, deemed reliable but not guaranteed.)